
Moundridge Manor
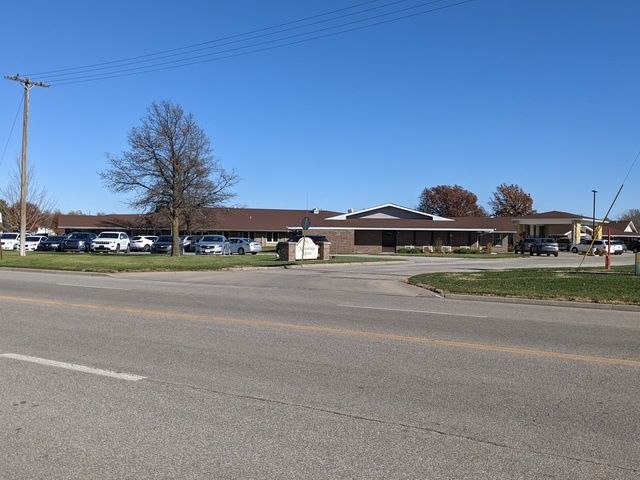
Moundridge Manor – Medicare Certified Since 2015
Local Comparison Snapshot
How Moundridge Manor compares to 170 facilities in Rural KS
Click a measure name to jump to details • Hover over ⓘ for definitions
Data from CMS Medicare Compare and Payroll-Based Journal. Area averages based on 170 facilities in Rural KS.
Ratings and staffing data typically reflect the most recent quarterly reporting period available.
View Other Options Near You

Medicare Star Ratings
Official CMS ratings based on health inspections, staffing, and quality measures
Data as of December 2025
Star Ratings History
Quarterly performance from 2013-2026
How Does This Facility Compare?
Compared to 170 other nursing homes in Rural KS
Based on CMS Medicare star ratings. Higher ratings indicate better performance.
Staffing Hours per Resident Day
Staffing data from CMS Payroll-Based Journal. Higher hours generally indicate more direct care time.
Staff Turnover Rate
Lower turnover rates generally indicate a more stable workforce and better continuity of care.
Agency/Contract Staff Usage
Lower agency usage often indicates better staff retention. High agency rates (>30%) may suggest staffing challenges.
Agency Staff Trends
Historical agency/contract staff usage by role
Data from CMS Payroll-Based Journal (PBJ). Agency % = contractor hours / total hours.
Direct Care Staffing
Average minutes of direct nursing care per resident per day
Data as of December 2025
Staffing Trends
Direct care minutes per resident per day
Occupancy Rate History
Average daily residents as a percentage of certified beds
Data from CMS Provider Info files. Occupancy = Average Residents per Day / Certified Beds.
Staff Turnover History
Annual percentage of nursing staff who left the facility
Data as of December 2025
Data from CMS Payroll-Based Journal. Turnover = staff who left during the year / total staff.
Average Daily Rate
Average daily charge for care at this facility
Based on CMS Cost Report data (inpatient revenue ÷ total patient days)
Data Source: Financial data from CMS Skilled Nursing Facility Cost Reports. Data typically lags 1-2 years. This information is for educational purposes only and should not be the sole basis for financial or care decisions. CareListings does not guarantee accuracy.
Financial Health
Comprehensive financial indicators from CMS Cost Reports
Data from fiscal year 2023 (most recent available - cost report data lags ~2 years)
Staff Investment: Higher spending per resident often correlates with better care quality.
Payer Mix: Shows revenue sources. Higher Medicare % typically means more post-acute/rehab care; higher Medicaid % indicates more long-term care residents.
Nonprofit/Government: May operate with lower margins while still providing quality care due to community mission.
Data Source: All financial data on this page comes from CMS Skilled Nursing Facility Cost Reports submitted by the facility to the Centers for Medicare & Medicaid Services. This information is provided for educational purposes only and should not be the sole basis for any financial or care decisions. Cost report data typically lags 1-2 years. CareListings does not guarantee the accuracy of this data.
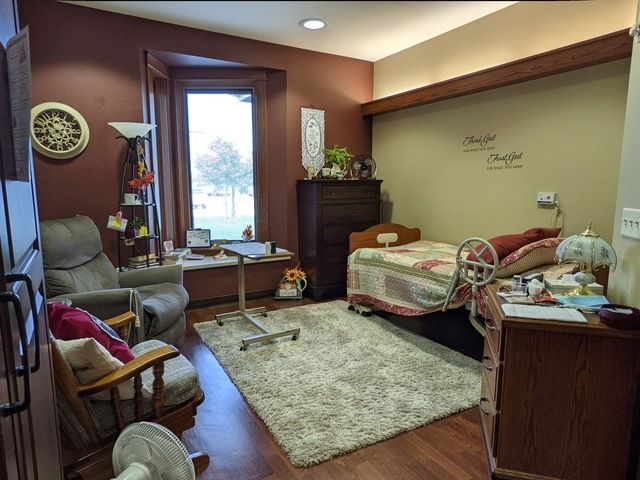
Who Stays Here
Breakdown of residents by payment type
Based on fiscal year 2023 cost report data
Average Length of Stay
How long residents typically stay at this facility
Based on fiscal year 2023 cost report data
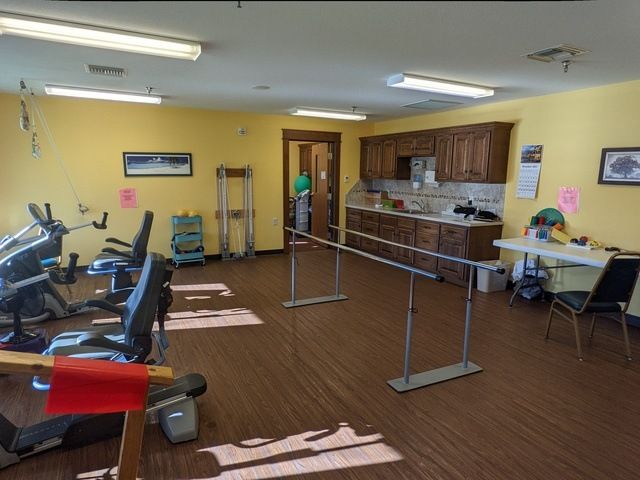
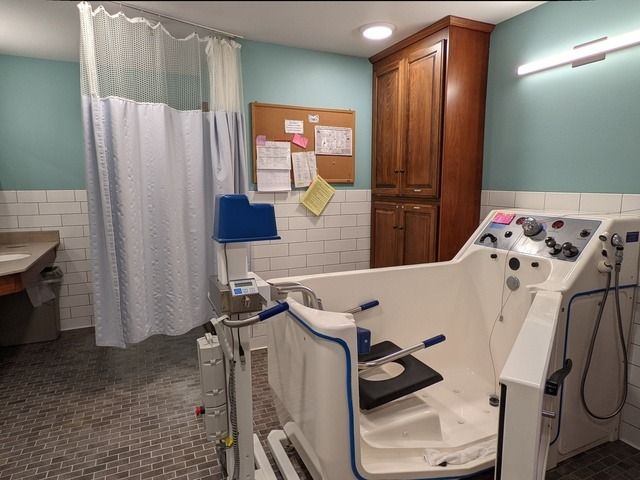
Services
Comprehensive skilled nursing services, rehabilitation programs, and medical care in MOUNDRIDGE
Specialties
Specialized care programs tailored to unique health needs
Join Our Caring Team
We're always looking for compassionate individuals who are dedicated to providing exceptional care for our residents. Explore career opportunities at Moundridge Manor.
Current Job Openings
Reviews

Moundridge Manor has one of the cleanest and organized nursing homes in Kansas. Not to mention, the staff is very welcoming! I love how everyone here cares about each other. The residents are treated with respect, and receive the professional care they deserve. I highly recommend this place for your loving ones!

We are blessed to have a nursing home that provides such great care for our Seniors. The staff is friendly, knowledgeable, and the facility is always clean. One of the Best Facilities in the State

We have been here to visit. Very friendly staff. Nice and clean. the whole place is very nice looking inside.


Explore Skilled Nursing Facilities Near Moundridge
Discover skilled nursing facilities in nearby communities
Hesston
7.0 mi away
Elyria
8.4 mi away
Goessel
9.8 mi away
Galva
12.1 mi away
Canton
13.0 mi away
North Newton
13.1 mi away
Halstead
13.4 mi away
Mcpherson
13.6 mi away
Inman
13.8 mi away
Newton
14.4 mi away
Buhler
14.5 mi away
Burrton
15.3 mi away
Walton
15.5 mi away
Lehigh
16.3 mi away
Hillsboro
20.3 mi away
Find Additional Care Services in Moundridge
Explore additional care options and services available in your area