Paramount Convalescent Hosp.
Skilled Nursing Facility • 59 Licensed Beds
8558 East Rosecrans Avenue, Paramount, CA
CMS Medicare Ratings
Overall
Inspection
Staffing
Quality
View details →
Call

Paramount Convalescent Hosp.

Skilled Nursing Facility • 59 Licensed Beds
8558 East Rosecrans Avenue,
Paramount, CA
CMS Medicare Ratings
Overall
Inspection
Staffing
Quality
View details →
About

Paramount Convalescent Hosp. – Medicare Certified Since 1974

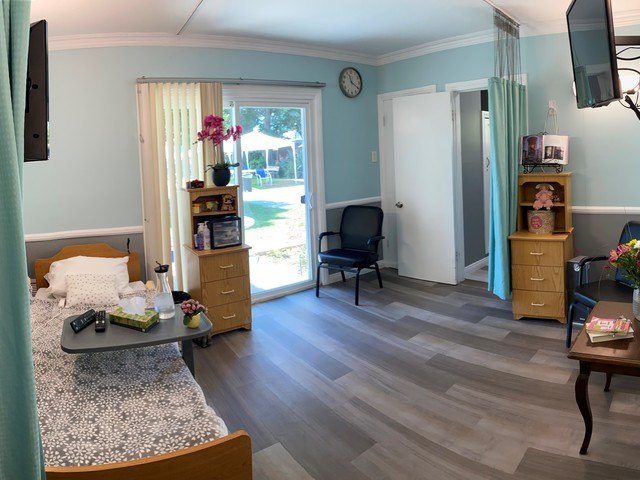
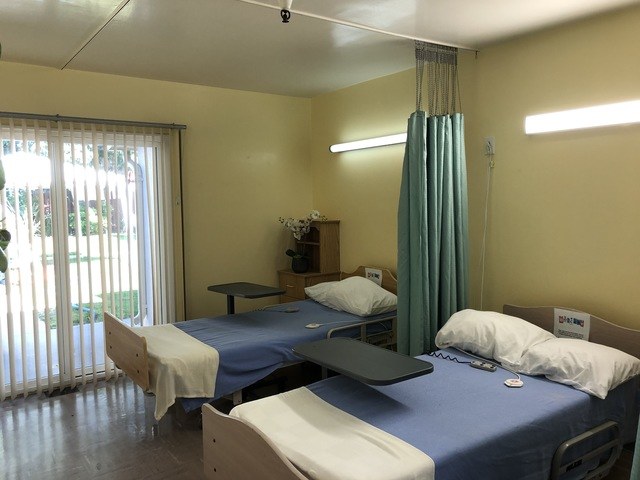
Paramount Convalescent Hosp. is a Medicare and Medicaid certified skilled nursing facility located in Paramount, California. This facility has been serving the community for 52 years. A Medicare-certified skilled nursing facility provides 24-hour nursing care, rehabilitation services, and assistance with activities of daily living for patients who need skilled nursing or rehabilitation services on a daily basis.

This facility has 59 certified beds with a current occupancy rate of 87% (averaging 51 residents per day), which is high. Skilled nursing facilities provide 24-hour nursing care for patients who need rehabilitation services after a hospital stay or ongoing care for chronic conditions. Services include skilled nursing, physical therapy, occupational therapy, speech therapy, and assistance with daily activities.

Staffing Levels: Based on CMS payroll data, this facility provides approximately 4.49 hours of total nursing care per resident per day (2.7 hours from CNAs, 1.36 hours from LPNs, 0.43 hours from RNs). Physical therapy staffing is 0.07 hours per resident per day. This staffing level meets research-recommended quality thresholds.

Medicare Quality Ratings: According to CMS, Paramount Convalescent Hosp. has an overall quality rating of 3 out of 5 stars, which is average compared to other nursing homes nationwide. Individual category ratings are: health inspection: 2 stars, staffing: 3 stars, quality measures: 5 stars.

Medicare Coverage: Medicare covers skilled nursing facility care for up to 100 days following a qualifying hospital stay of at least 3 days. Days 1-20 are fully covered by Medicare, days 21-100 require a daily coinsurance payment. Many residents also use Medicaid, private insurance, or pay privately for long-term stays.

Questions to Ask: When visiting a nursing home, ask about: staff-to-resident ratios and RN coverage around the clock, how they handle medical emergencies, activities and therapy programs, how they communicate with families, their approach to falls prevention, and policies for managing resident complaints.

Visit Medicare Care Compare to view detailed ratings, inspection reports, staffing data, and compare this facility with others in the area.

Quality ratings and facility data are updated periodically by CMS. We recommend verifying current information at Medicare Care Compare.

Show Phone

Local Comparison Snapshot

How Paramount Convalescent Hosp. compares to 377 facilities in Los Angeles-Long Beach-Glendale, CA

Click a measure name to jump to details • Hover over for definitions

Measure
This Facility
Area Avg
Comparison
Overall Rating
Medicare 5-star rating
3
2.5
Quality Measures
Clinical outcomes & safety
5
4
Health Inspections
State survey results
2
2.1
Staffing
Nurse-to-resident ratio
3
3
Staffing Hours (per resident/day)
RN Hours
Registered nurses
0.43 hrs
0.59 hrs
LPN/LVN Hours
Licensed practical nurses
1.36 hrs
1.29 hrs
CNA Hours
Certified nursing assistants
2.70 hrs
2.62 hrs
Total Nursing Hours
CNA + LPN + RN combined
4.50 hrs
4.51 hrs
Agency/Contractor Usage
Lower agency use often indicates more stable, consistent care
RN Agency Use
% of RN hours from contractors
0 %
2.7 %
LPN/LVN Agency Use
% of LPN hours from contractors
0 %
2.3 %
CNA Agency Use
% of CNA hours from contractors
0 %
3.1 %
Staff Stability & Occupancy
Staff Turnover
Annual nursing staff turnover
22 %
35 %
Occupancy Rate
Percentage of beds filled
87 %
91 %
Financial Estimate
Based on CMS Cost Report data (for reference only)
Est. Daily Rate
Average cost per day
$884
$482
Estimate Only: This figure is calculated from cost reports and is for informational purposes only. Actual rates vary significantly. See details or contact the facility.
Better than Area
Near Average
Below Area Average

Data from CMS Medicare Compare and Payroll-Based Journal. Area averages based on 377 facilities in Los Angeles-Long Beach-Glendale, CA.
Ratings and staffing data typically reflect the most recent quarterly reporting period available.

View Other Options Near You

Featured

Harbor Post Acute Care Center

21521 S. VERMONT AVENUE
Torrance, CA 90502 (9 miles away)
Skilled Nursing Facility • 127 beds
★★★★★ 3.6 (27 reviews)
Show Phone
View Listing

Granada Hills Care Center

16123 CHATSWORTH AVE
Granada Hills, CA 91344 (31 miles away)
Skilled Nursing Facility • 48 beds
★★★★★ 4.1 (30 reviews)
Show Phone
View Listing
Featured

Astoria Nursing and Rehab Center

14040 ASTORIA STREET
Sylmar, CA 91342 (33 miles away)
Skilled Nursing Facility • 218 beds
★★★★★ 3.2 (48 reviews)
Show Phone
View Listing

La Paz Geropsychiatric Center

8835 VANS STREET
Paramount, CA 90723 (< 1 miles away)
Skilled Nursing Facility • 173 beds
Show Phone
View Listing

Downey Post Acute

13007 S. PARAMOUNT BLVD.
Downey, CA 90242 (1 miles away)
Skilled Nursing Facility • 99 beds
Show Phone
View Listing

Meadow Creek Post-Acute

7039 ALONDRA BLVD
Paramount, CA 90723 (2 miles away)
Skilled Nursing Facility • 104 beds
Show Phone
View Listing

Lakewood Healthcare Center

12023 LAKEWOOD BLVD.
Downey, CA 90242 (2 miles away)
Skilled Nursing Facility • 290 beds
Show Phone
View Listing
Claimed

Sunset Villa Post Acute

3232 E. ARTESIA BLVD.
Long Beach, CA 90805 (2 miles away)
Skilled Nursing Facility • 199 beds
★★★★★ 4.5 (70 reviews)
Show Phone
View Listing

Bellflower Post Acute

9710 E. ARTESIA AVE
Bellflower, CA 90706 (2 miles away)
Skilled Nursing Facility • 59 beds
Show Phone
View Listing

The Springs Post-Acute

10625 LEFFINGWELL ROAD
Norwalk, CA 90650 (2 miles away)
Skilled Nursing Facility • 99 beds
Show Phone
View Listing

Medicare Star Ratings

Official CMS ratings based on health inspections, staffing, and quality measures

Data as of December 2025

What do Medicare star ratings measure?
Medicare rates nursing homes on a 1-5 star scale based on three key areas: health inspection results, staffing levels, and quality measures like falls and infections.
How often are ratings updated?
CMS updates nursing home ratings monthly. Ratings can change based on new inspection results, staffing data from payroll records, and clinical quality outcomes.
Overall Rating
3/5
Quality Measures
5/5
Health Inspections
2/5
Staffing
3/5

Star Ratings History

Quarterly performance from 2013-2026

View on Medicare.gov
Overall
Health Inspections
Quality
Staffing
Source: Centers for Medicare & Medicaid Services

How Does This Facility Compare?

Compared to 377 other nursing homes in Los Angeles-Long Beach-Glendale, CA

Why compare to local facilities?
Local comparisons account for regional staffing markets and demographics. A facility performing above local averages often indicates strong management and quality care relative to area standards.
Paramount Convalescent Hosp.
Los Angeles-Long Beach-Glendale, CA Average

Based on CMS Medicare star ratings. Higher ratings indicate better performance.

Staffing Hours per Resident Day

Paramount Convalescent Hosp.
Los Angeles-Long Beach-Glendale, CA Average

Staffing data from CMS Payroll-Based Journal. Higher hours generally indicate more direct care time.

Staff Turnover Rate

Paramount Convalescent Hosp.
Los Angeles-Long Beach-Glendale, CA Average

Lower turnover rates generally indicate a more stable workforce and better continuity of care.

Agency/Contract Staff Usage

Paramount Convalescent Hosp.
Los Angeles-Long Beach-Glendale, CA Average

Lower agency usage often indicates better staff retention. High agency rates (>30%) may suggest staffing challenges.

Agency Staff Trends

Historical agency/contract staff usage by role

What does agency usage indicate?
Agency/contract staff fill temporary staffing gaps. Lower percentages typically indicate a stable, permanent workforce. Facilities with consistently high agency usage (>30%) may face staff retention challenges, though temporary spikes can occur during seasonal illness or transitions.
CNA
LPN
RN

Data from CMS Payroll-Based Journal (PBJ). Agency % = contractor hours / total hours.

Direct Care Staffing

Average minutes of direct nursing care per resident per day

Data as of December 2025

Understanding staffing levels: Higher staffing is associated with better quality outcomes. Research suggests around 4.1 hours of total nursing care per resident per day as a quality benchmark. Compare this facility's staffing to local averages to assess relative care levels.
162
minutes/day
CNAs
Certified Nursing Assistants
82
minutes/day
LVNs
Licensed Vocational Nurses
26
minutes/day
RNs
Registered Nurses
4
minutes/day
PTs
Physical Therapists

Staffing Trends

Direct care minutes per resident per day

CNAs
LVNs
RNs
PTs
Source: Centers for Medicare & Medicaid Services

Occupancy Rate History

Average daily residents as a percentage of certified beds

Understanding occupancy: Higher occupancy can indicate strong community reputation and demand. Very low occupancy may affect financial stability, while extremely high occupancy could mean limited bed availability.
Paramount Convalescent Hosp.
Los Angeles-Long Beach-Glendale, CA Average (90.7%)

Data from CMS Provider Info files. Occupancy = Average Residents per Day / Certified Beds.

Staff Turnover History

Annual percentage of nursing staff who left the facility

Data as of December 2025

Understanding turnover: Lower turnover rates generally indicate a more stable workforce and better continuity of care. High turnover can affect care quality and resident relationships. The national average for nursing homes is around 50-60%.
All Nursing Staff
Registered Nurses (RN)
Area Average

Data from CMS Payroll-Based Journal. Turnover = staff who left during the year / total staff.

Average Daily Rate

Average daily charge for care at this facility

Based on CMS Cost Report data (inpatient revenue ÷ total patient days)

FY 2023 Daily Rate
$884
per resident per day
Compared to 374 facilities in your area
Above local median ($482)
Daily Rate Trend (2018-2023)
Contact Facility for Actual Rates
This figure is an average calculated from cost reports and is for informational purposes only. Actual rates vary significantly based on level of care needed, room type, payer source (Medicare, Medicaid, private pay), and other factors. Please contact the facility directly for current pricing and availability.
How This Is Calculated
This average daily rate is calculated from CMS Cost Reports by dividing total inpatient revenue by total patient days. It represents an average across all payers and care levels. Higher rates may indicate more intensive care, specialized services, or regional cost factors.

Data Source: Financial data from CMS Skilled Nursing Facility Cost Reports. Data typically lags 1-2 years. This information is for educational purposes only and should not be the sole basis for financial or care decisions. CareListings does not guarantee accuracy.

Financial Health

Comprehensive financial indicators from CMS Cost Reports

Data from fiscal year 2023 (most recent available - cost report data lags ~2 years)

For-Profit Facility

Financial Summary

Metric This Facility Local Median Comparison
Operating Margin
Profitability ratio
0% 0% Below
Net Income
Annual profit or loss
$1,109,954 $355,061.5 Above
Staff Cost per Resident
Daily salary expense per resident
$271/day $205/day Higher
Occupancy Rate
Bed utilization percentage
87% 89% Lower
Est. Daily Rate
Average revenue per patient day
$884/day $482/day Higher
Total Beds
Licensed bed capacity
59 99 Smaller

Local comparisons based on 374 skilled nursing facilities in the Los Angeles-Long Beach-Glendale, CA metro area

Revenue & Expenses

Net Patient Revenue
After adjustments & allowances
$9,946,306
Operating Expenses
Total operating costs
$9,978,547
Total Salaries
Staff compensation
$5,139,788
Contract Labor
Agency & temp staff
$7,435

Payer Mix

Medicare
25%
Medicaid
61%
Private Pay & Other
14%

Operating Margin Trend (2018-2023)

Understanding Financial Health
Operating Margin: Percentage of revenue remaining after operating costs. Positive = profitable operations.
Staff Investment: Higher spending per resident often correlates with better care quality.
Payer Mix: Shows revenue sources. Higher Medicare % typically means more post-acute/rehab care; higher Medicaid % indicates more long-term care residents.
Nonprofit/Government: May operate with lower margins while still providing quality care due to community mission.

Data Source: All financial data on this page comes from CMS Skilled Nursing Facility Cost Reports submitted by the facility to the Centers for Medicare & Medicaid Services. This information is provided for educational purposes only and should not be the sole basis for any financial or care decisions. Cost report data typically lags 1-2 years. CareListings does not guarantee the accuracy of this data.

Who Stays Here

Breakdown of residents by payment type

Based on fiscal year 2023 cost report data

Total Days
18,978
Medicare
Short-term skilled nursing
25%
Medicaid
Long-term care residents
61%
Private Pay / Other
Self-pay, insurance, VA
14%
Higher Medicare %
Indicates more short-term rehabilitation residents. Medicare typically covers up to 100 days of skilled nursing care after a hospital stay.
Higher Medicaid %
Indicates more long-term care residents. Medicaid covers nursing home care for those who qualify financially.

Average Length of Stay

How long residents typically stay at this facility

Based on fiscal year 2023 cost report data

Overall Average
52.57
days
Medicare Stays
59.30
days
Medicaid Stays
53.27
days
Total Admissions
262
Total Discharges
361
Medicare (Short-Term)
Medicare covers skilled nursing for rehabilitation after a hospital stay. Typical stays are 20-30 days for recovery from surgery, stroke, or illness.
Medicaid (Long-Term)
Medicaid covers long-term nursing home care for those who qualify. Many residents stay months or years, receiving ongoing daily care and support.

Services

Comprehensive skilled nursing services, rehabilitation programs, and medical care in PARAMOUNT

Looking for Caregiver or Nursing Jobs?

Create a free profile to connect with senior care employers in Paramount, CA. Browse open positions, get matched with opportunities, and take the next step in your caregiving career.

Find Jobs Near Me
Create a free job seeker profile →

Explore Skilled Nursing Facilities Near Paramount

Discover skilled nursing facilities in nearby communities

Bellflower

1.6 mi away

Downey

2.6 mi away

East Rancho Dominguez

2.8 mi away

Lynwood

3.4 mi away

South Gate

3.5 mi away

Norwalk

4.2 mi away

Compton

4.2 mi away

Bell Gardens

4.3 mi away

Lakewood

4.6 mi away

Cudahy

4.6 mi away

Artesia

4.7 mi away

Santa Fe Springs

5.2 mi away

Willowbrook

5.3 mi away

Cerritos

5.3 mi away

Bell

5.7 mi away

Find Additional Care Services in Paramount

Explore additional care options and services available in your area